The Meeting Metric Most Leaders Have Never Tracked
I used to think I knew who was contributing in my meetings.
I had a strong sense of the room. Who drove the conversation. Who asked the sharp questions. Who sat quietly through the whole session and left without leaving a mark. That intuition felt reliable because it was built on years of watching people work.
It was not reliable. It was a memory built on recency and volume. The loudest voices in the most recent meetings were the ones I remembered. The people who contributed precisely once but that contribution changed the direction of a decision were invisible in my mental model. The person who had been gradually withdrawing over the past two months had done it slowly enough that I had not consciously noticed.
The only way I found out how wrong my intuition was came from the data. And what the data showed me changed how I managed people.

Who Drives Your Rooms
In every team I have ever led, participation in meetings has followed the same rough pattern. A small number of people carry the conversation. They ask the questions, propose the options, push back on the assumptions. A larger number of people are present but peripheral. They attend, they process, they occasionally confirm or agree, but they rarely drive.
This is not always a problem. Some meeting formats are designed for one person to present and others to absorb. But in collaborative sessions where decisions are being made and problems are being solved, consistently unbalanced participation is a signal that something is wrong.
The hard part is knowing which signal it is.
An unbalanced room might mean the wrong people are in it. You have invited people who are not actually decision-makers into a decision-making meeting and they are correctly deferring to the people who are. Or it might mean the right people are there but the format is wrong. The meeting is structured in a way that rewards the loudest voice rather than the best thinking. Or it might mean something more difficult: a team member who was once engaged has quietly disengaged, and the gradual withdrawal is happening beneath the threshold of what a leader notices without data.
These three causes require three very different responses. Diagnosing the wrong one costs you time and trust.
The Problem With Managing From Memory
The reason most leaders get this wrong is not that they are inattentive. It is that the human brain is not built to track participation patterns across dozens of meetings over months. It remembers the moments that stood out. The heated exchange. The unexpected insight. The silence that felt uncomfortable. Everything between those moments blurs.
What you are left with is a composite impression of each person built from a handful of memorable moments and weighted heavily toward recent events. If someone had a strong month three months ago and a quiet month recently, you will manage them as if they are having a quiet phase even if the trend is actually a sustained withdrawal that started six months earlier.
Managing from that impression produces the wrong interventions at the wrong times. You give development opportunities to the people who are already loud. You leave quieter contributors underdeveloped because their contribution style does not register in your memory model. You have performance conversations based on your recent impression of someone rather than on what their participation pattern actually shows.
I experienced this directly. A team member I had assessed as disengaged turned out, when I looked at the actual data, to have a consistently high contribution rate in sessions where the facilitator was someone other than me. That told me something useful about my own facilitation style that my impression of them had completely hidden.
What Per-Speaker Data Actually Shows
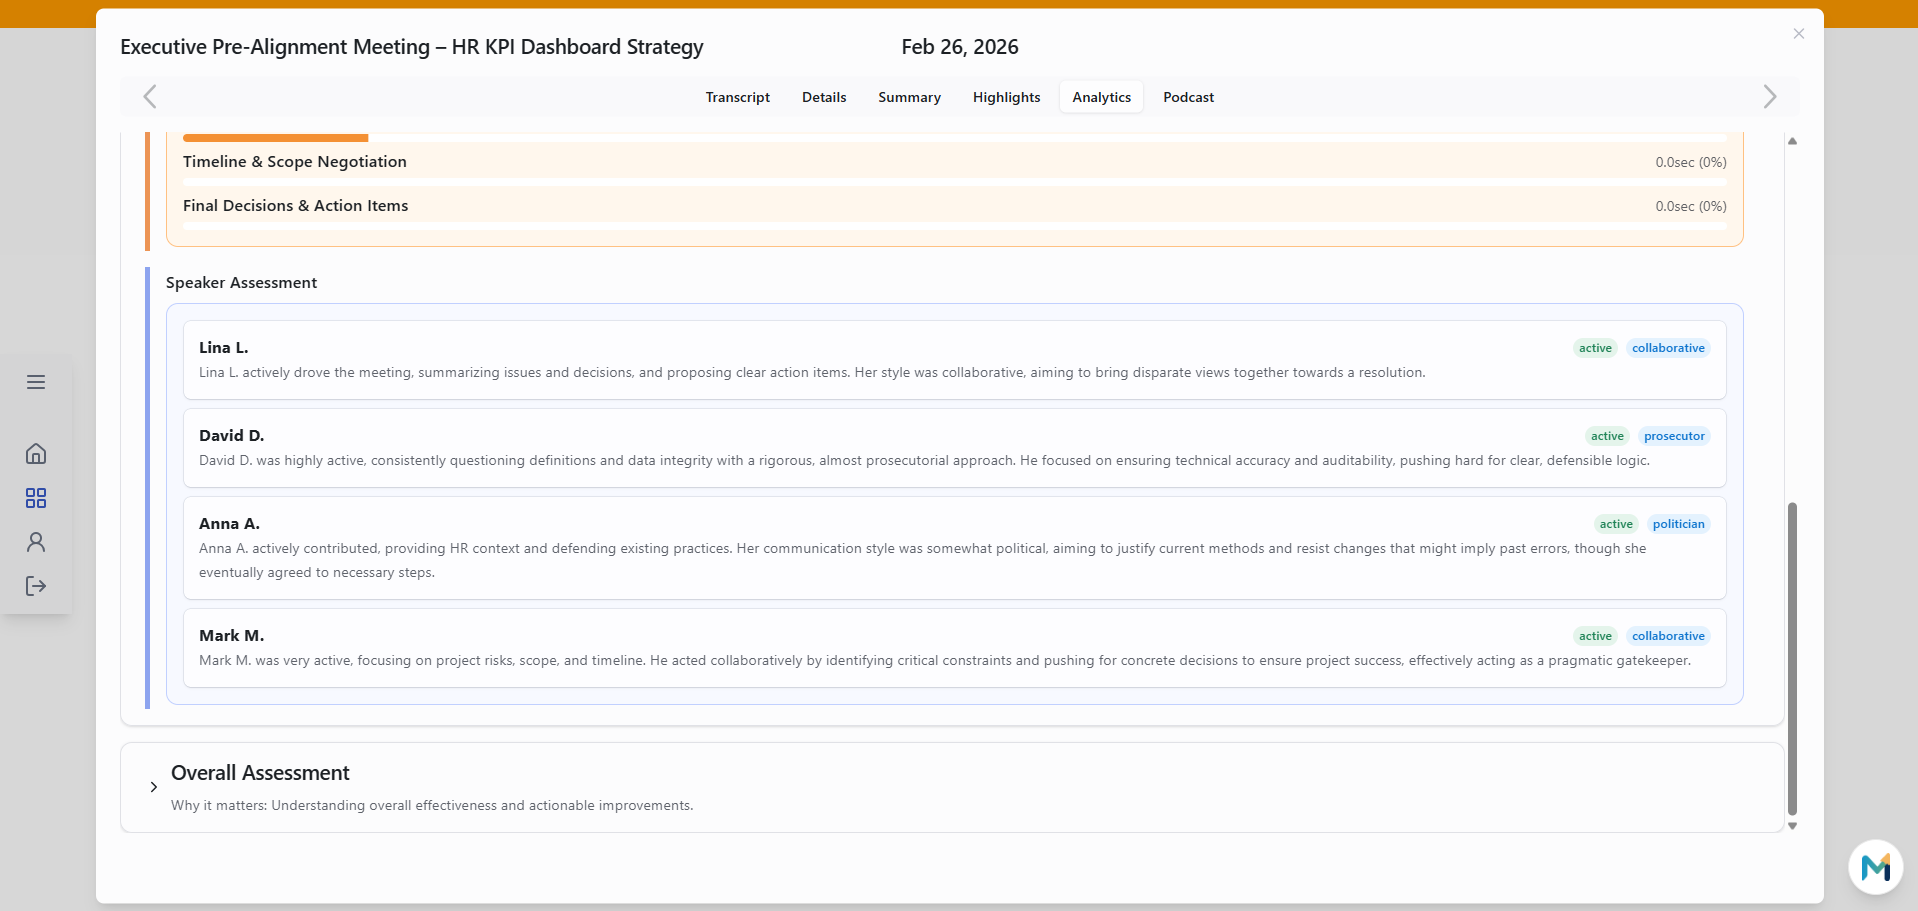
The Meeting Analytics layer in Minuteory produces a Speaker Assessment for every participant in every meeting. This is not a transcript summary. It is a structured analysis of each person's communication behavior, contribution style, and engagement patterns based on what they actually said and how they said it.
For each participant the assessment shows their communication style tags: active, collaborative, analytical, facilitative, and others based on the actual pattern of their contributions. It shows an AI-generated narrative of their behavior in that specific session. And across multiple meetings it builds a longitudinal picture of how each person's participation is evolving over time.
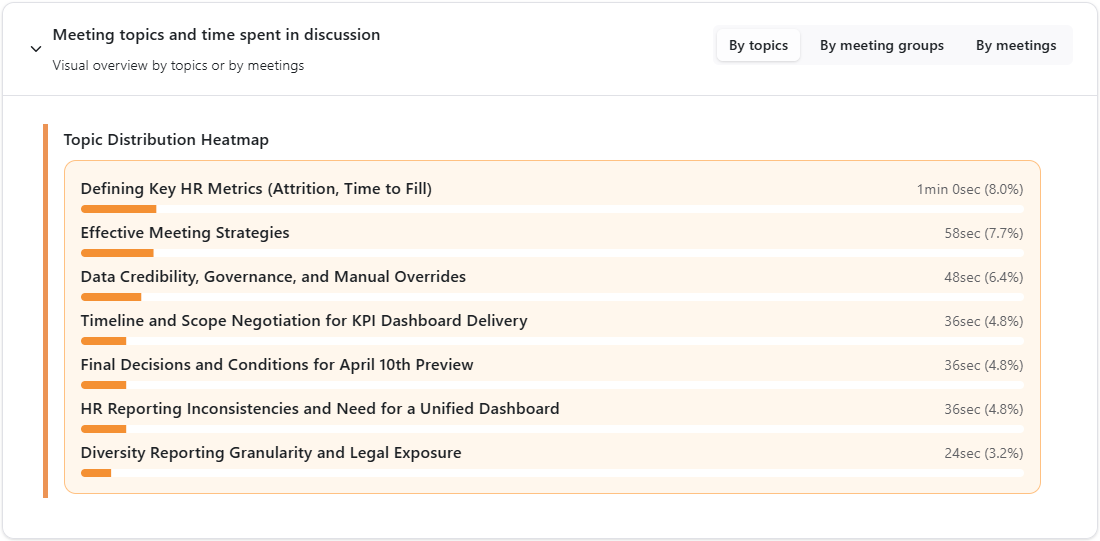
The Topic Distribution panel sits alongside this. It shows a horizontal bar chart of every detected topic in the meeting with the time spent on each and the percentage of total meeting time. When you look at topic distribution alongside speaker assessment you start to see things that are otherwise invisible: who drives which topics, whether the time allocation matched the stated agenda, and whether the people who should own a topic are actually the ones leading the conversation about it.
This is not surveillance. It is the same kind of awareness a skilled leader builds through years of careful observation, made available systematically for every meeting rather than only for the ones you happened to be watching carefully.
What Changes When You Have This Over Time
A single meeting's speaker assessment is useful. Six months of speaker assessments across a team is a different kind of tool entirely.
The patterns that emerge over time are the ones that matter most. A team member whose communication style shifts from collaborative to peripheral over three months is telling you something important. A meeting format that consistently produces low contribution from the people who should be most engaged is telling you something about the format. A workspace where one person drives every significant decision across every meeting type is telling you something about the organisation's dependency risk.
These patterns are completely invisible without longitudinal data. You cannot see them in a single meeting. You cannot feel them reliably in your daily interactions. They only become clear when the data accumulates over enough sessions to separate signal from noise.
Minuteory builds this picture automatically. The Speaker Assessment runs on every meeting without anyone needing to configure it or remember to check it. Over time the workspace-level analytics show participation trends across the team that give a leader the kind of visibility that used to require years of careful observation to approximate.
The Conversation This Changes
The most immediate practical change is in one-to-one conversations.
When you sit down with a team member and you have their actual participation pattern in front of you, the conversation changes. You are not working from your impression of the last three weeks. You are working from a structured record of how they have showed up across every meeting they have attended in the past month.
That changes what you say. Instead of "I have noticed you seem a bit quieter lately" you can say "I can see that in the last four project reviews you have contributed significantly less than you did in the standup format. I wanted to understand what is different in those sessions for you." That is a specific question. It opens a real conversation. It tells the person you are paying attention to them specifically, not just reacting to a general impression.
It also changes what you hear. A team member who knows their participation is tracked is less likely to rely on a single strong contribution to carry their visibility for the month. The accountability is embedded in the system rather than dependent on whether the right person happened to be paying attention at the right moment.
What to Check This Week
Take your last month of meetings. Without looking at any data, write down your three highest contributors and your three lowest.
Then look at who actually spoke in those meetings, what they said, and how often.
In most cases the list you wrote from memory and the list the data would produce are not identical. The gaps between them are where your management decisions are being made on incorrect information.
Minuteory gives you that data automatically from every meeting your team runs. If you want to see what your team's participation pattern actually looks like rather than what you think it looks like, start at app.minuteory.com today.